How to Take Advantage of Graphic Organizers
Reading and taking notes can be a daunting task, especially when you’re dealing with large amounts of information. However, using a graphic organizer can make the process much easier and more efficient. A graphic organizer is a visual tool that helps you to organize information and ideas, making it easier to understand and remember. In this post, we’ll explore some of the best ways to use a graphic organizer when you read and take notes.
1. Choose the Right Type of Graphic Organizer
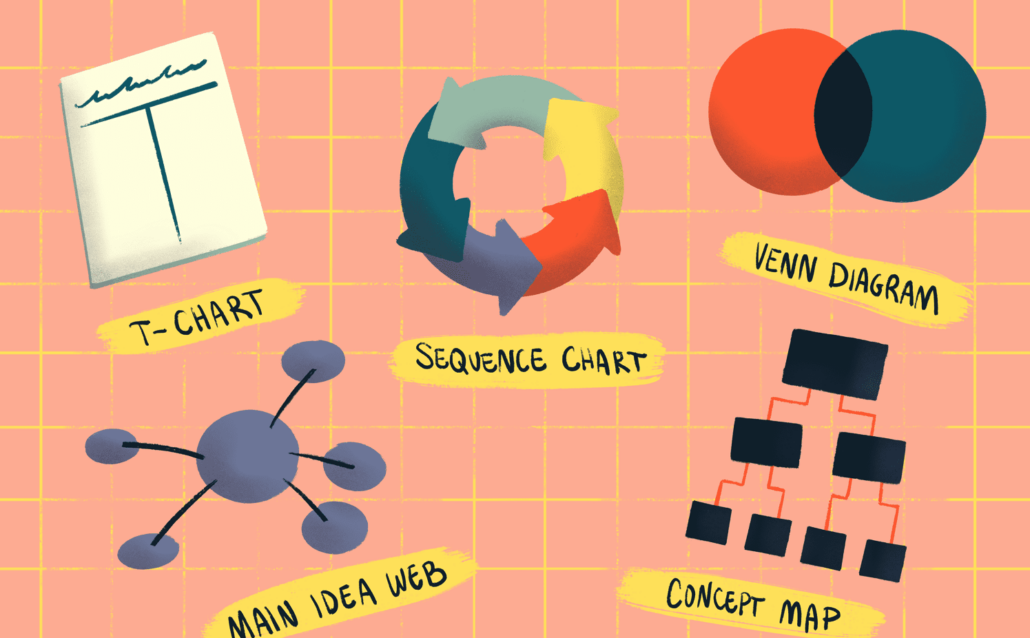
There are many different types of graphic organizers, and choosing the right one can make a big difference in how effectively you can organize your thoughts and information. Some common types of graphic organizers include:
- Mind maps: A mind map is a visual diagram that helps you to organize your thoughts and ideas around a central theme. They can be useful for brainstorming, outlining, and summarizing information.
- Venn diagrams: A Venn diagram is a graphic organizer that helps you to compare and contrast two or more things. They can be useful for identifying similarities and differences between concepts or ideas.
- Flowcharts: A flowchart is a visual representation of a process or sequence of events. They can be useful for understanding complex procedures or steps in a process.
- T-charts: A T-chart is a graphic organizer that allows you to compare two different pieces of information side-by-side. They can be useful for analyzing data, identifying cause-and-effect relationships, or comparing and contrasting different ideas.
2. Preview the Text
Before you start reading, take a few minutes to preview the text and get a sense of its structure and content. This can help you to determine which graphic organizer would be most effective for taking notes. Look at headings, subheadings, and any bold or italicized text, as these can give you a clue as to the main ideas and concepts in the text.
3. Identify Key Ideas
As you read, look for the main ideas and concepts in the text. Use headings and subheadings as a guide, and highlight or underline any important information. This will help you to focus on the most important information and avoid getting bogged down in irrelevant details.
4. Create the Graphic Organizer
Once you have identified the key ideas, create a graphic organizer to help you organize the information. Depending on the type of text you’re reading and the information you want to capture, you might use a mind map, a Venn diagram, a flowchart, or a T-chart. You can create your graphic organizer using pen and paper or use an online tool such as MindMeister or Lucidchart.
5. Fill in the Details
Once you have your graphic organizer in place, start filling in the details. Use the headings and subheadings as a guide, and fill in any important information that you highlighted or underlined while reading. If you’re using a mind map or flowchart, you might include key phrases or concepts in each branch or box. If you’re using a T-chart or Venn diagram, you might fill in specific details in each column or section.
6. Review and Revise
Once you have filled in your graphic organizer, take a few minutes to review it and make any necessary revisions. Look for any gaps in the information and fill them in, or remove any information that is not relevant. This will help to ensure that your graphic organizer accurately reflects the most important information from the text.
7. Use Your Graphic Organizer to Study and Review
Finally, use your graphic organizer to study and review the information. Whether you’re preparing for a test or trying to understand a complex topic, a graphic organizer can be a useful tool for reviewing and summarizing information. Use your graphic organizer to quiz yourself, create flashcards as we suggest in the previous post, or write a summary of the information. This will help to reinforce the information!
Graphic organizers are one of many tools that we use to help students struggling with reading comprehension.

